What Are Trend Indicators?

Stock Trading Strategies
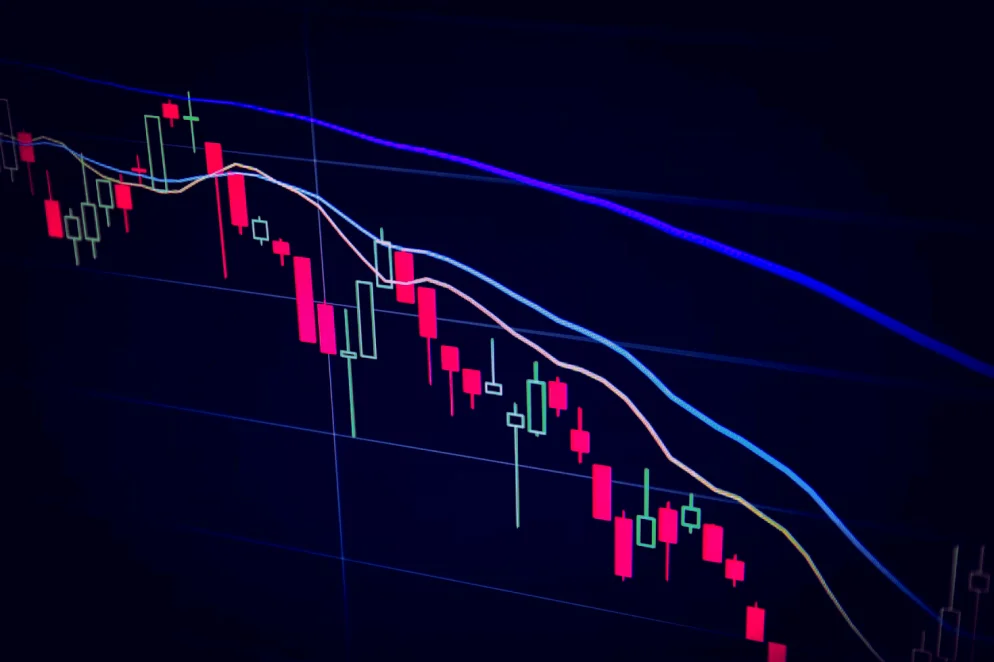
A trend indicator is a technical analysis tool that is used to identify the direction and strength of a trend in a financial market, such as a stock market. Trend indicators can be based on a variety of data points, such as price, volume, or other market-based metrics, and are designed to help traders identify the direction of the market and make more informed trading decisions.
There are many different trend indicators that traders can use, and the specific indicator that is best suited for a particular trading strategy may depend on the market being traded, the time frame being analyzed, and the trader’s individual goals and risk tolerance. Some common trend indicators include:
- Moving averages: Moving averages are a type of trend indicator that plots the average price of a security over a specific time period, such as 50 or 200 days. Moving averages can help traders identify the direction of the trend and can be used to generate buy or sell signals.
- Moving average convergence divergence (MACD): The MACD is a trend indicator that plots the difference between two moving averages and is often used to identify changes in the direction of the trend.
- Trend lines: Trend lines are a simple trend indicator that plots a straight line on a chart to connect the highs or lows of a security over a specific time period. Trend lines can help traders identify the direction and strength of the trend and can be used to generate buy or sell signals.
- Parabolic stop and reverse (Parabolic SAR): The Parabolic SAR is a trend indicator that plots points on a chart to indicate the direction and strength of the trend. The indicator is designed to help traders identify when the trend may be reversing, and can be used to generate buy or sell signals.